 |
||||||

|

|

|

|

|

|
|
 |
||||||
|
The KMeD project has completed. The KMeD website now serves as a historical record of the findings and accomplishments of the KMeD team. A part of the National Science Foundation Scientific Database Initiative Grant IRI 9116849 Last updated on June 12th, 2001 |
 |
|
|
Through KMeD PICQUERY+, the user can specify preferred analysis, presentation, or visualization methods. These methods can be generic, custom-made, or integrated from third-party developers. Our design's modularity permits the future integration of multimedia or virtual reality technology into the present architecture. Post-Retrieval ProcessingData that is retrieved from a query can be piped through KMeD PICQUERY+'s processing tables to produce analyses and alternative displays of this information. An example can be seen below, with a screenshot of KMeD's histogram display.
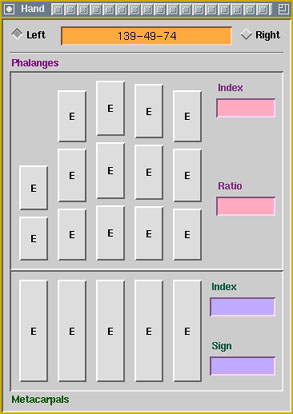
Custom Data DisplaysThe screenshots below illustrate some of the custom display windows that have been developed for KMeD: one is a custom patient display, while the other shows a patient's hand. The letters within the hand display's buttons indicate the current growth stage of the button's corresponding hand bone.
Multiple ViewsCertain objects, particularly image and multimedia data, can be viewed in multiple ways. In the instance shown below, KMeD offers the user a choice between two available image viewers. Click on it to view the control panel for an ImageMagick viewer.
Image DisplaysWe have integrated ImageMagick, a public-domain image visualization and processing package, as one of KMeD's many presentation tools; sample screenshots over a magnetic resonance image (MRI) of the brain are shown below. Other commercial programs may be integrated in a similar manner.
|

|
| Return to the previous KMeD page |